


Lowering Monthly Electric Bills with Solar Roofs
How Solar Energy Reduces Reliance on the Grid and Cuts Electricity Costs
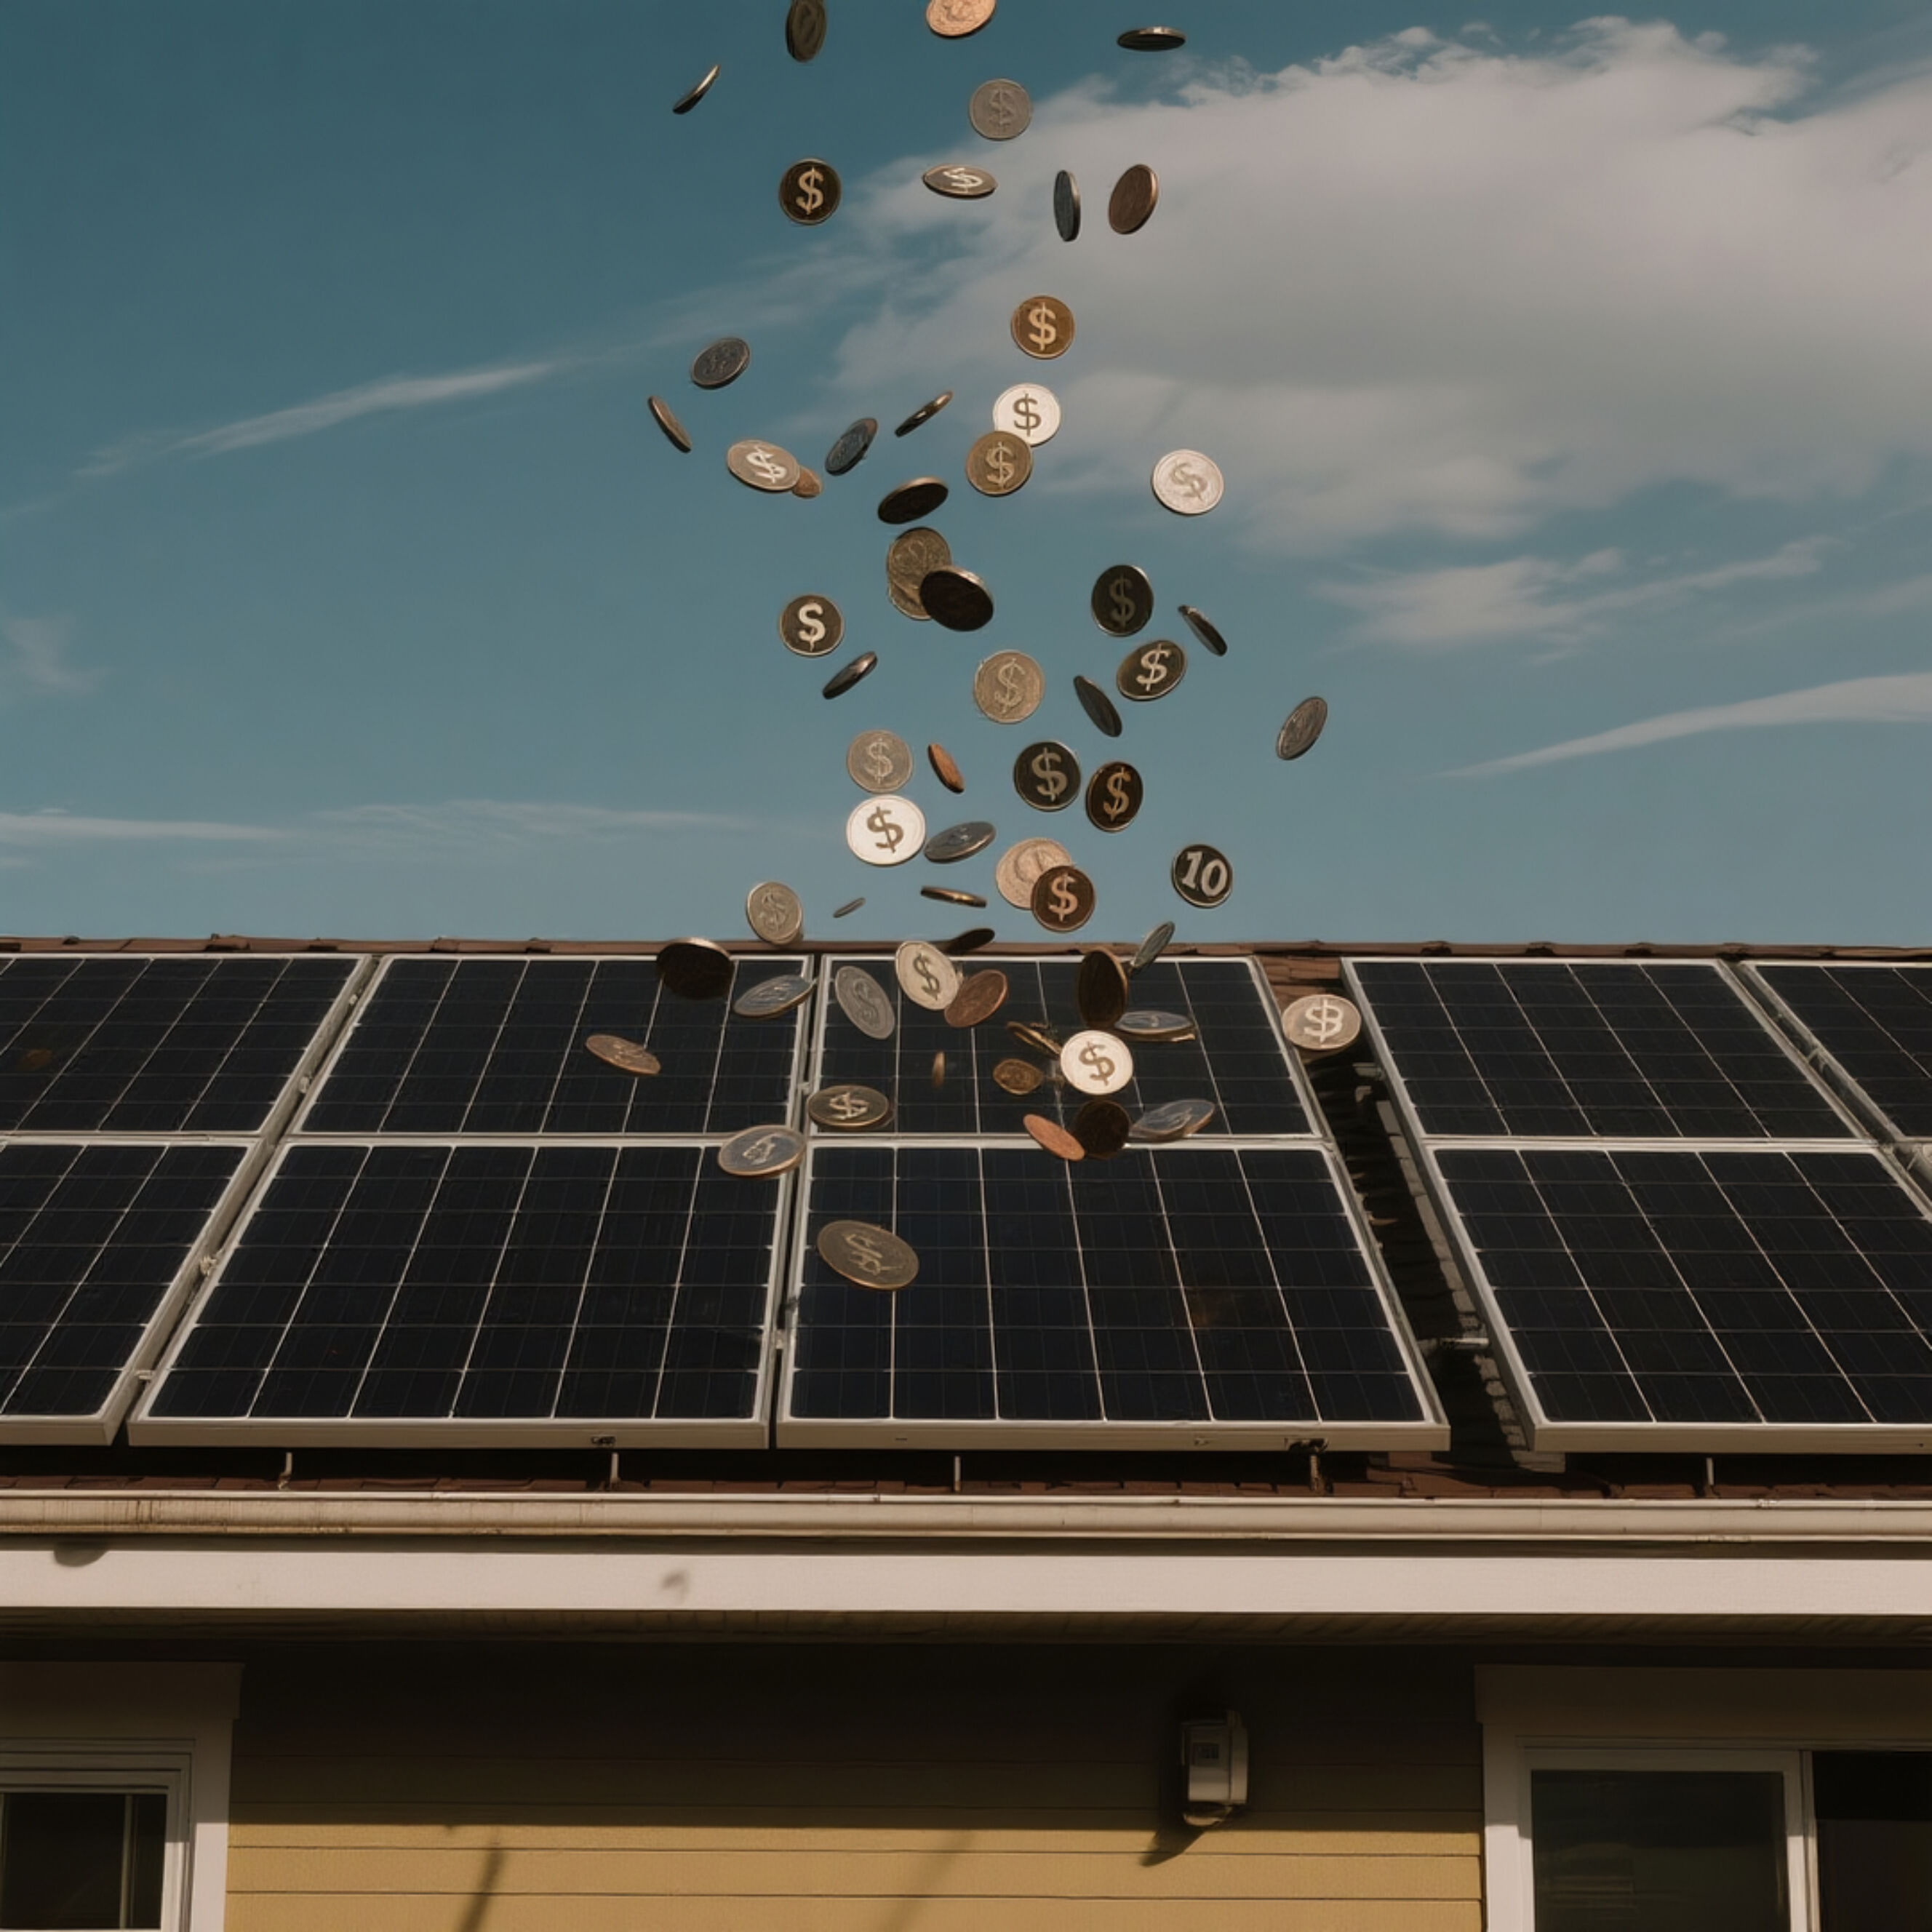
Solar roofs convert sunlight into electricity using photovoltaic cells, offsetting grid consumption and reducing utility bills. By generating power on-site, homeowners gain independence from rising energy prices—a growing concern as residential electricity rates increased 6.2% between 2022 and 2023 (U.S. Energy Information Administration, 2023).
Measuring Real-World Utility Bill Savings After Solar Roof Installation
Most homeowners cut their monthly electric bills by 60–90%, depending on system size, local climate, and energy use. Over 25 years, these savings typically exceed $50,000, according to the U.S. Department of Energy, thanks to reduced or eliminated grid dependence.
Case Study: Homeowners Achieving 60–90% Reductions in Energy Expenses
A 2024 analysis of 1,200 solar-powered homes found a 72% median reduction in electricity costs within the first year. For 33% of participants, solar production covered 100% of energy needs during peak sunlight months, effectively eliminating their grid usage.
Net Metering: Earning Credits by Selling Surplus Solar Power Back to the Grid
Net metering allows homeowners to receive credits for excess energy sent back to the grid, which offsets consumption during nights or cloudy days. As of 2023, 41 states mandate net metering programs, enhancing the financial return of solar installations.
Rising Utility Rates vs. Stable Solar-Powered Energy Costs Over Time
While traditional electricity prices have risen at an average of 3% annually since 2000, solar roof owners lock in stable energy costs after installation. This insulation from rate hikes provides long-term budget predictability and strengthens the economic case for going solar.
Long-Term Financial Returns of Solar Roof Investments
Calculating 25-Year Savings Potential of Solar Roofs
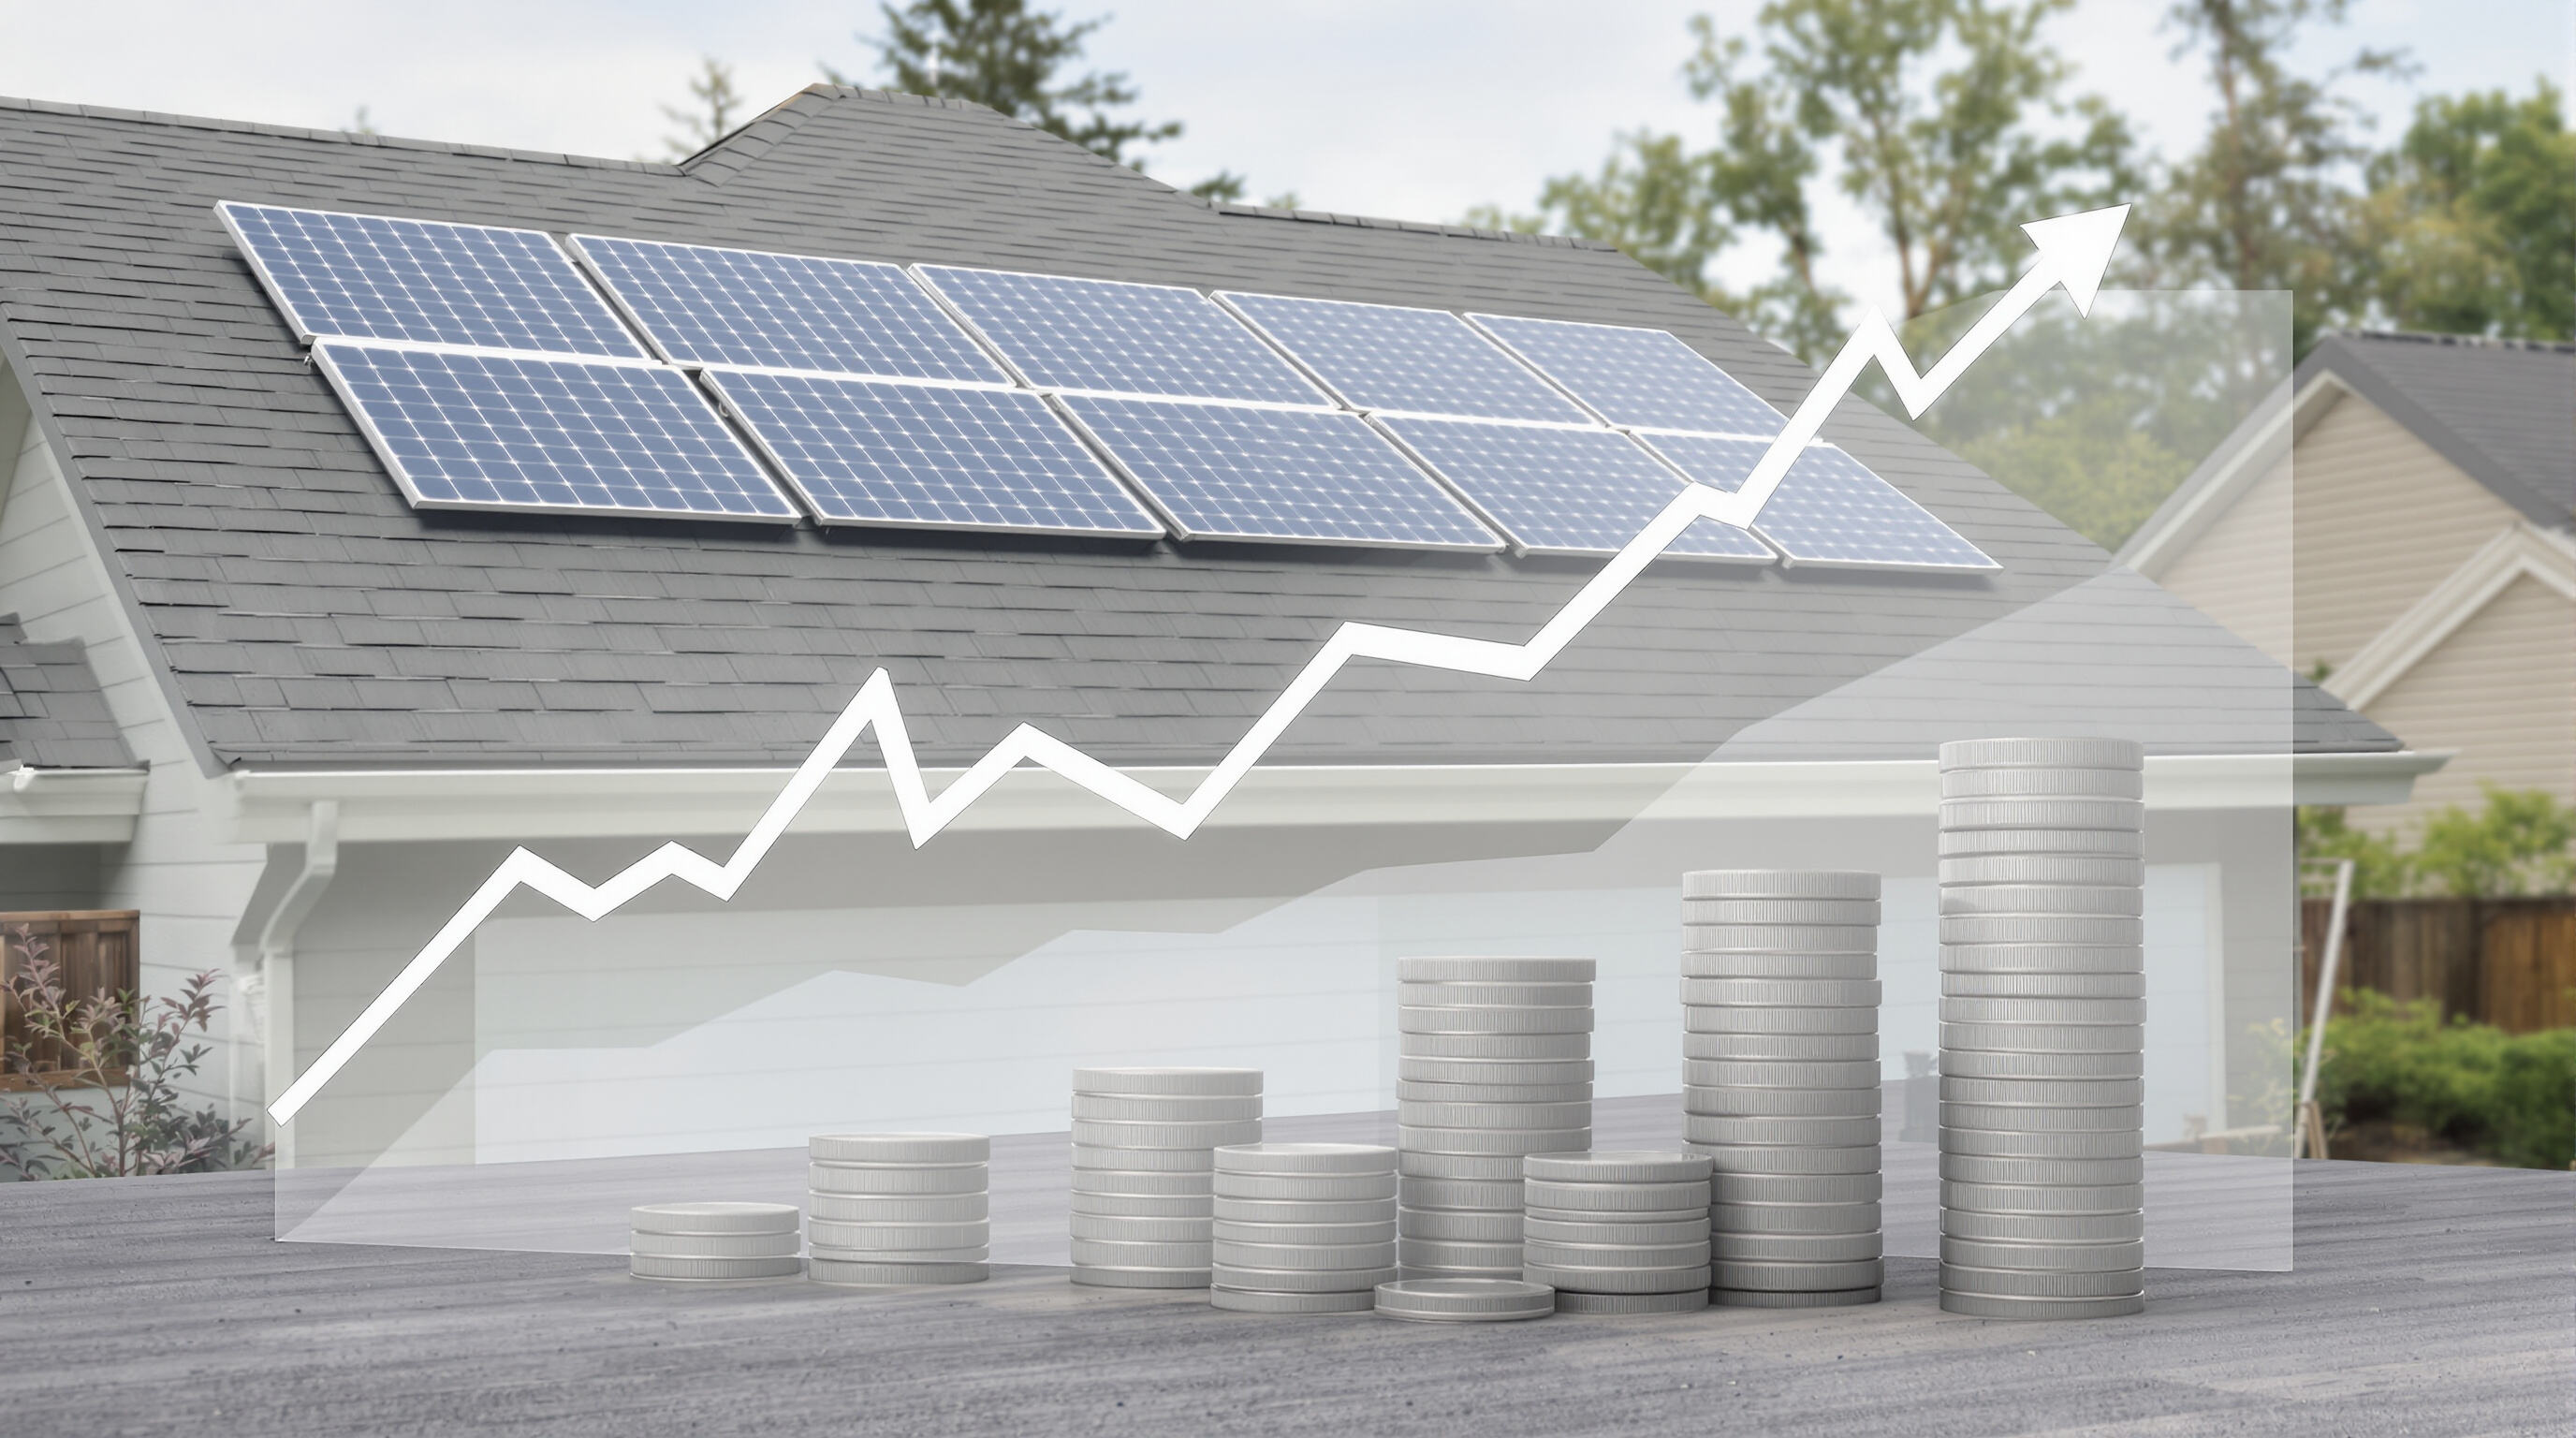
The value of solar roofs keeps growing as those monthly electric bills keep going up. Most modern installations only lose around 1% efficiency each year, so they still work pretty well even after two and a half decades according to research from Renewable Energy Journal back in 2023. Electricity rates have been on an upward trend for quite some time now, which means homeowners are seeing real money saved over the long run. On average folks save about $31,500 throughout the system's life span. But in places where power costs are especially high like California and Massachusetts, savings can actually hit upwards of $45,000 based on what various residential solar return on investment studies have shown recently.
Average Lifetime Savings Exceed $30,000: What Impacts Total ROI?
Four key factors shape solar investment returns:
- System size aligned with household energy use
- Local electricity rates (savings are highest where rates exceed $0.20/kWh)
- Availability of tax credits and net metering policies
- Roof orientation and shading
Homeowners who design systems to produce 110% of current usage maximize net metering benefits, accelerating payback and boosting long-term savings.
Year-by-Year Breakdown of Energy Cost Reductions
An 8 kW solar system generates substantial and growing savings over time:
| Year | Utility Rate | Solar Production Value | Annual Savings |
|---|---|---|---|
| 1 | $0.15/kWh | $1,380 | $1,300 |
| 5 | $0.17/kWh | $1,310 | $1,500 |
| 10 | $0.22/kWh | $1,220 | $2,100 |
Despite slight panel degradation, rising utility rates drive an inflation-adjusted return of 214% over 25 years in high-cost markets (Energy Economics Report, 2023).
Short-Term Savings and Solar Payback Period
Understanding the Solar Payback Period for Solar Roofs
The payback period measures how quickly energy savings recoup the initial investment. It's calculated by dividing net system cost (after incentives) by annual savings. A typical system costing $18,552 after tax credits and saving $2,613 per year breaks even in 7.1 years. This timeframe is critical for assessing near-term financial viability.
National Average Payback: 6–9 Years with Faster Returns in High-Electricity-Cost Areas
The national average payback period is currently 7.1 years, according to industry analysis. In areas where electricity exceeds 20¢/kWh, such as California and Massachusetts, payback often falls below six years due to higher baseline savings and supportive local incentives.
Key Factors Accelerating Return on Investment
Several variables shorten the payback window:
- High electricity rates: Increase annual savings by 15–30%
- State/local incentives: Rebates up to $2,000 reduce upfront costs
- Optimal system sizing: Matches or slightly exceeds energy demand
- Sunlight availability: Regions with 250+ sunny days generate 18% more power
Homeowners leveraging all four factors typically achieve payback 1–3 years faster than average, freeing capital sooner for other uses.
Government Incentives That Reduce Solar Roof Costs
Federal Solar Tax Credit: Claiming Up to 30% Off Installation Costs
The Solar Investment Tax Credit (ITC) allows homeowners to deduct 30% of installation costs from federal taxes through 2032. On a $25,000 system, this equals a $7,500 credit. Since its launch in 2006, the ITC has helped drive a 48-fold increase in U.S. solar adoption (Solar Energy Industries Association).
State and Local Incentives That Improve Affordability and Access
Beyond federal support, over 35 states offer additional incentives such as rebates, property tax exemptions, or performance-based payments. In Southwest utilities, homeowners may earn $0.08–$0.15 per kWh for surplus energy via net metering. Some municipalities also waive permit fees or fast-track approvals, saving $500–$2,000 in soft costs.
How Rebates and Financing Options Boost Long-Term Savings
When combining the federal 30% investment tax credit with various state rebates, overall system costs drop somewhere between 40 and 55 percent. Take Massachusetts as an example where homeowners could get around $1,000 back from their state plus take advantage of those special low interest solar loans that are becoming pretty common these days. There's also another option worth mentioning called power purchase agreements or PPAs for short. With this arrangement, there's no need to spend any money upfront at all. Instead, people just pay a set amount each month, usually about 20 to 30 percent cheaper than what they would normally pay their electric company. The company installing the panels gets all those nice tax breaks instead. Most folks find that these different financial approaches mean their systems start paying for themselves much faster than expected, often within five to seven years depending on local conditions and incentives available.
Increased Home Value and Energy Independence with Solar Roofs
Solar Roofs Increase Property Value by an Average of 4.1%
Homes with solar roofs sell for 4.1% more on average, according to EnergySage's 2024 market analysis, with premiums reaching 6.9% in high-demand states like California and Texas. Systems paired with battery storage further enhance appeal by offering backup power and greater energy independence.
Growing Buyer Demand for Homes with Solar Installations
Solar-equipped homes sell 20% faster than non-solar homes, driven by buyer interest in lower operating costs. Among real estate agents, 68% report that solar installations influence purchasing decisions—especially among millennial and Gen Z buyers who prioritize sustainability.
Protecting Against Rising Electricity Costs Through Energy Self-Sufficiency
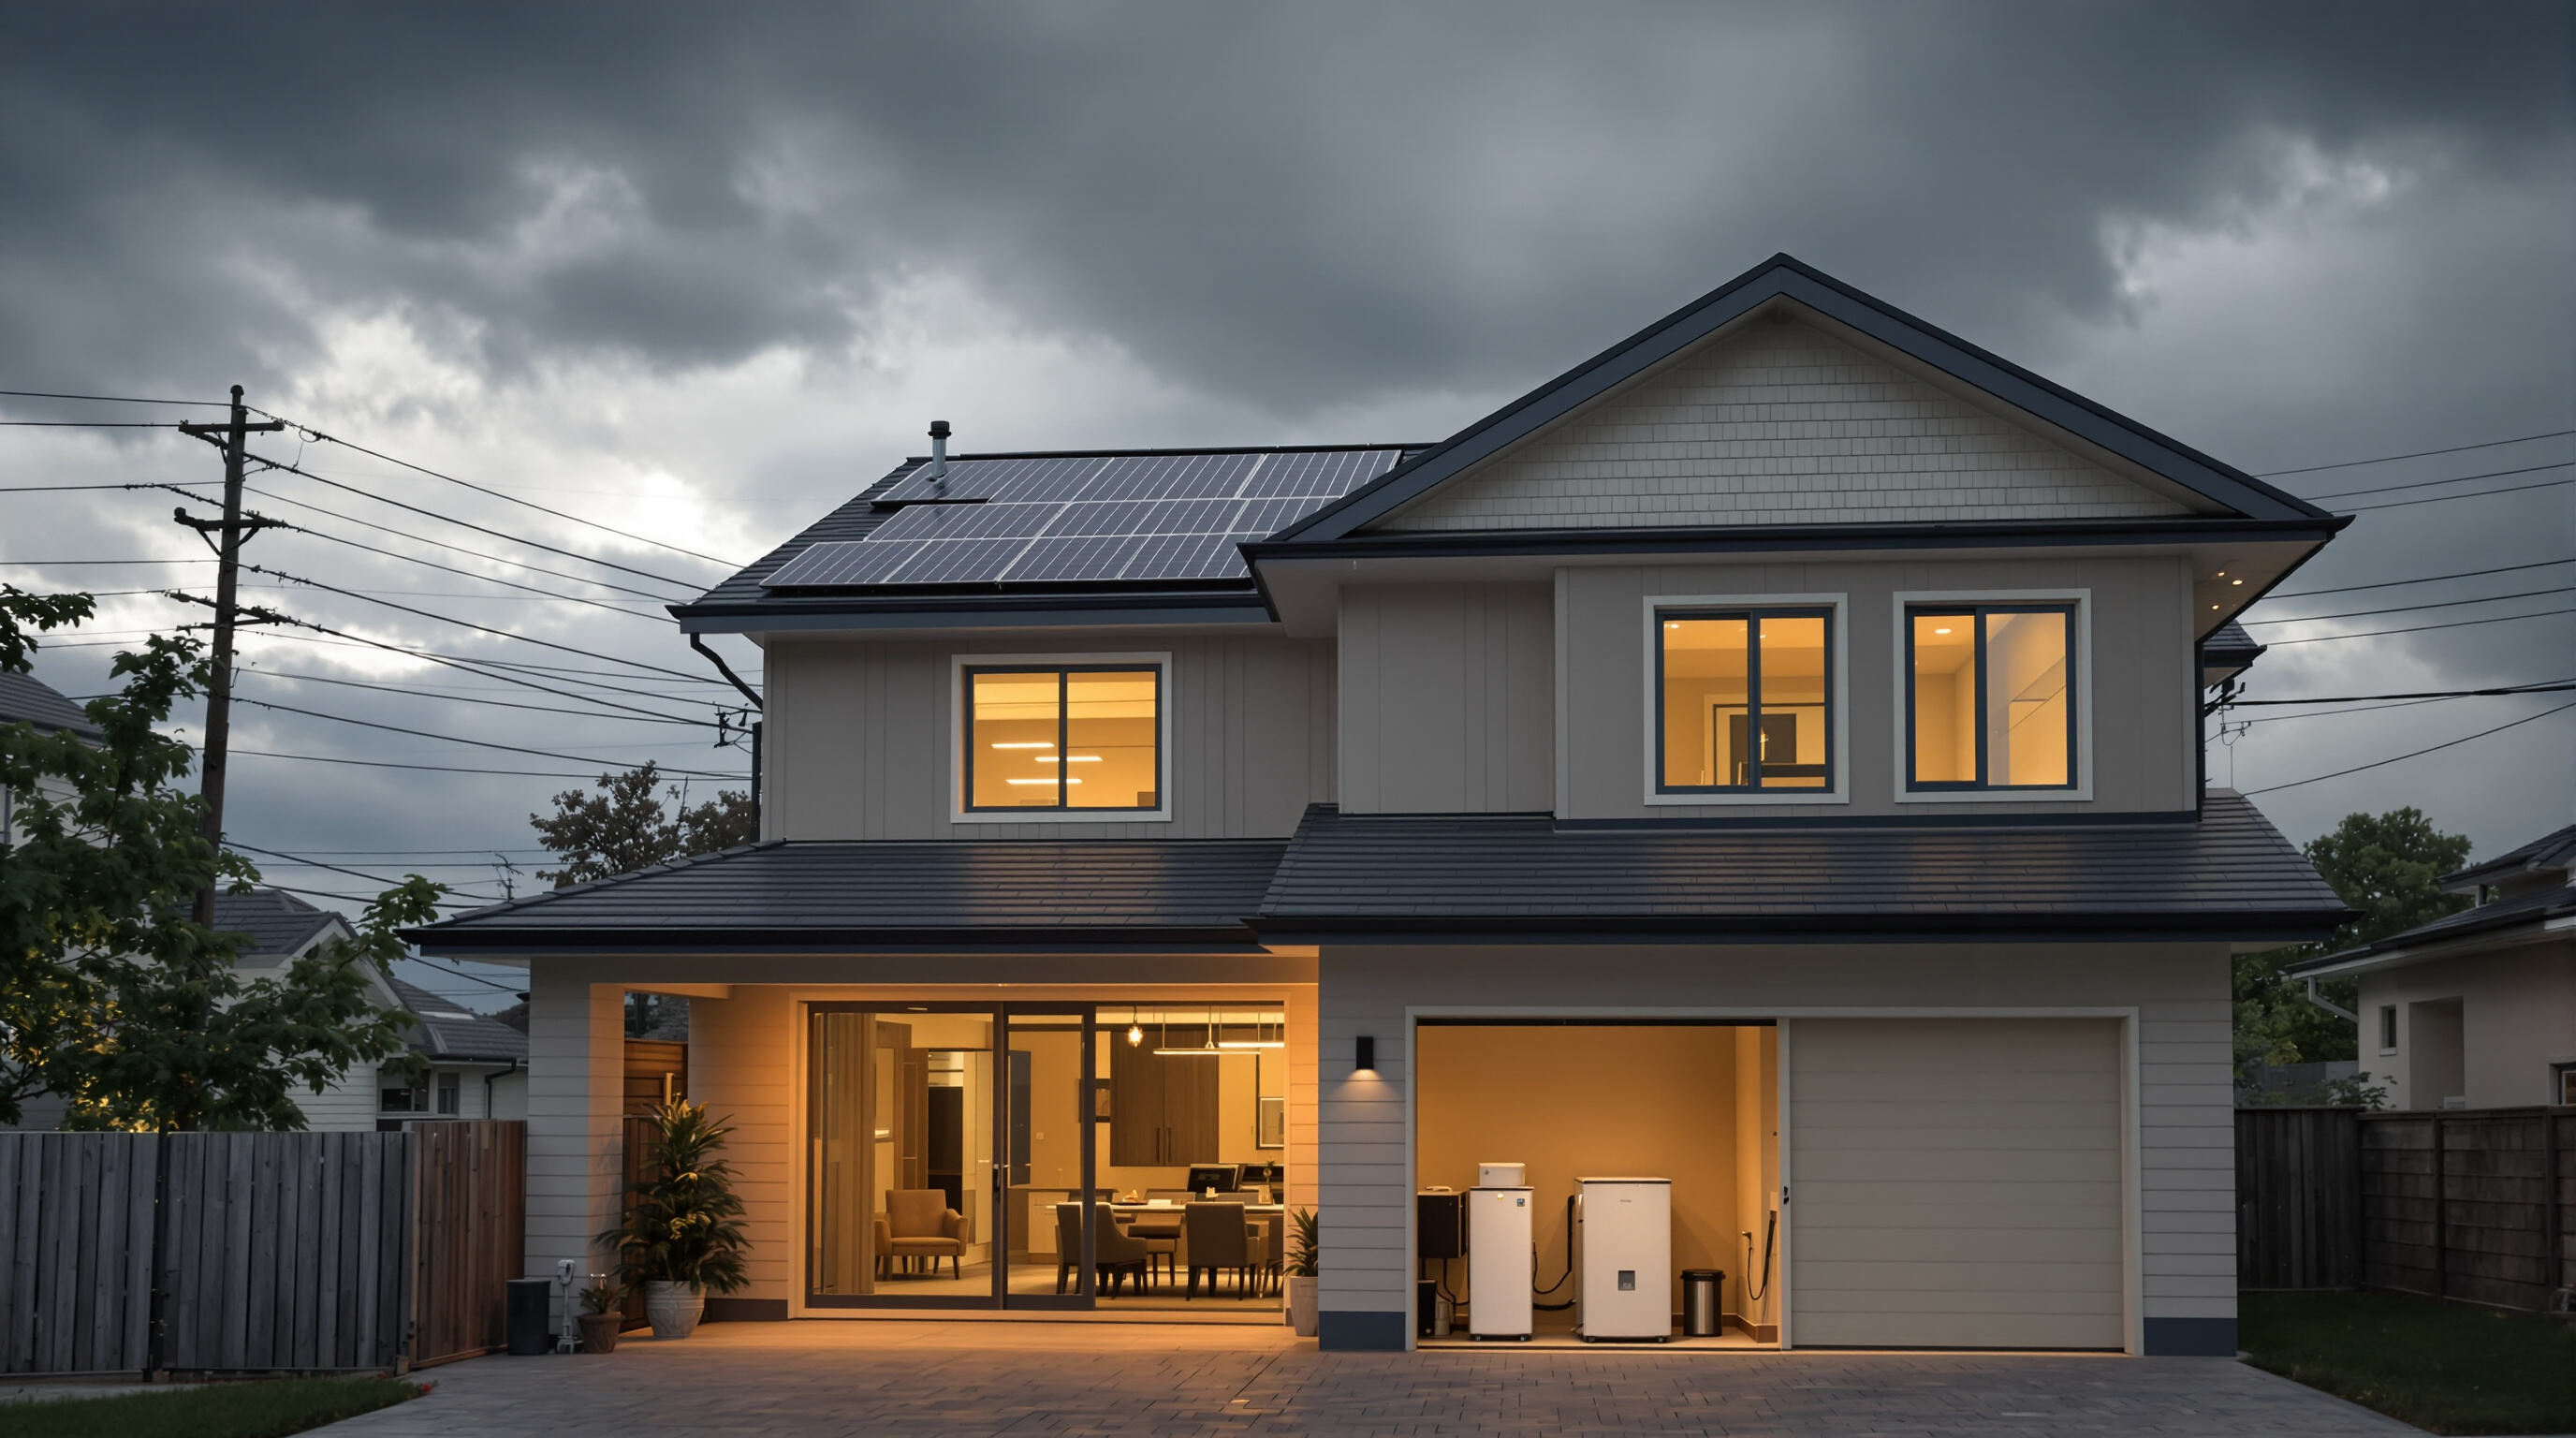
By covering 60–90% of energy needs, solar roofs significantly reduce reliance on the grid. When paired with batteries, they provide uninterrupted power during outages—an increasingly valuable feature amid more frequent extreme weather events.
Historical Trend: 3% Annual Increase in U.S. Electricity Prices Enhances Solar Value
Electricity prices have risen nearly 3% per year since 2015, while solar energy costs remain fixed after installation. Over 25 years, this gap translates to average savings of $29,000, positioning solar roofs as a powerful hedge against energy inflation.
Frequently Asked Questions
How much can I save on my electric bill with solar roofs?
Most homeowners experience reductions of 60-90% in their monthly electric bills after installing solar roofs.
What is net metering?
Net metering allows homeowners to earn credits for excess solar energy sent back to the grid, offsetting future electricity consumption costs.
What is the typical payback period for solar roof investments?
The national average payback period is 7.1 years, but it can be as low as 6 years in areas with high electricity costs.
What are the key incentives for installing solar roofs?
Incentives include the federal Solar Investment Tax Credit, state and local rebates, and performance-based payments.
Table of Contents
-
Lowering Monthly Electric Bills with Solar Roofs
- How Solar Energy Reduces Reliance on the Grid and Cuts Electricity Costs
- Measuring Real-World Utility Bill Savings After Solar Roof Installation
- Case Study: Homeowners Achieving 60–90% Reductions in Energy Expenses
- Net Metering: Earning Credits by Selling Surplus Solar Power Back to the Grid
- Rising Utility Rates vs. Stable Solar-Powered Energy Costs Over Time
- Long-Term Financial Returns of Solar Roof Investments
- Short-Term Savings and Solar Payback Period
- Government Incentives That Reduce Solar Roof Costs
- Increased Home Value and Energy Independence with Solar Roofs
- Historical Trend: 3% Annual Increase in U.S. Electricity Prices Enhances Solar Value
- Frequently Asked Questions